Development Site Monthly

An Interactive Newsletter
The Knakal Map Room

Welcome to 2025!

The Development Site Monthly is a newsletter designed to keep you informed on the latest trends and insights in the development site market. BKREA has made a tangible commitment to focusing on this sector of the market and creating a knowledge base that is unparalleled in the industry. BKREA is currently handling over $2 billion in land exclusives and we engage with developers and sellers on a daily basis. As such, our team is constantly analyzing market shifts, policy changes, value trends and their impact on the development site market in New York City. Each month, we’ll provide updates on the development pipeline, tracking all pending and active sites from East 96th Street (east side) and West 110th Street (west side) down to the southern tip of Manhattan. Additionally, we’ll share trend comparisons, policy updates, and insights from property owners, developers, architects, attorneys, and zoning consultants. And coming soon is The Knakal Land Index which will be a comprehensive look at the market for land transactions dating back to 1984!

Inside The Knakal Map Room

BKREA Lifetime Statistics

$22B

Total Building Sales

2,342

Buildings Sold

85M+

Total Square Feet Sold

40+ YR

NYC CRE Market Expertise

Interest Rates

Policy Update: City of Yes for Housing Opportunity

The City of Yes legislation is, perhaps, the most positive and important piece of legislation passed in many years. It is crystal clear that incentivizing the creation of more housing supply is the solution to New York City’s housing crisis. During the pandemic, vacancy in Manhattan rose significantly, which is the equivalent of an increase in supply. As a result, residential rents dropped by 30%. There has not been a housing policy implemented anywhere in the United States that resulted in rents going down by even 10%. We need new supply and City of Yes will make it a bit easier for developers to create that new supply.

Here is an explanation of some of the component parts of the City of Yes legislation:

Universal Affordability Preference (UAP)
The UAP program (which replaces the former Voluntary Inclusionary Housing program) introduces a density bonus available in R6-R12 districts citywide for developments that provide permanently affordable housing. Developers can increase floor area by up to 20% and gain height increases, provided that a portion of the units meet affordability requirements. The bonus residential FAR must be allocated entirely to affordable units, which may seem onerous until you consider that providing affordable units is the key to qualifying for the 485x tax abatement.

For example, suppose you're developing a new building in an R8B district. Before City of Yes (CoY), your maximum residential FAR was 4.0, and your maximum building height was 85 feet. If you sought the 485x abatement, you would have been required to make 20% of the building affordable, resulting in 3.2 FAR for market-rate units and 0.8 FAR for affordable units. With the UAP program, you gain an increased FAR of 4.8 and a new maximum building height of 95 feet. This allows for 3.84 FAR market-rate and 0.96 FAR affordable, demonstrating how the 485x and UAP programs work seamlessly together.
Relaxed and Streamlined Transfers of Floor Area from Landmarked Sites
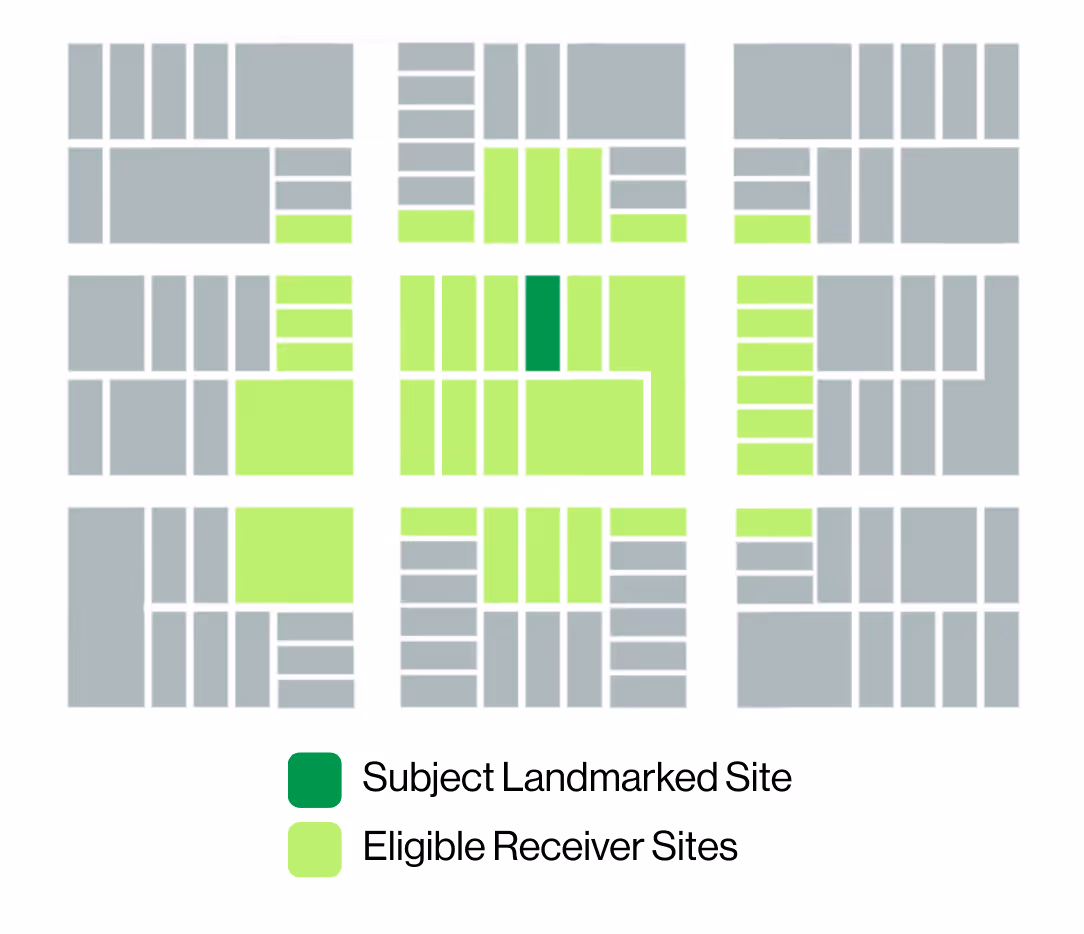
Until now, individual landmarks have only been able to transfer their unused floor area to adjacent sites, sites directly across the street, or sites directly across the corner. Additionally, any bulk modifications required going through the full ULURP process, which explains why such transfers have not been as frequent as one might suspect. All of that changes with City of Yes for Housing Opportunity (COYHO).

First, landmarks can now transfer floor area anywhere on their block, to properties on blockfronts across the street from their block (north, south, east or west), or to properties diagonally across to the corner property only. Read further down in this newsletter for a more complete explanation. This update fundamentally transforms the market for landmark development rights as most landmarks now have significantly more sites they can transfer their air-rights to, while developers have more options from which to potentially acquire air-rights.

Second, as long as the bulk can be accommodated as-of-right, the transfer can now be done by "certification"—no ULURP, no City Council approval, no two-year drawn-out process. This is a game changer. Do not overlook it. There are caps on the magnitude of increase the receiving site can achieve.
Creation of R11 and R12 Districts
You might have noticed that when we were discussing UAP (above), we mentioned R11 and R12 districts. These new districts are now officially part of the Zoning Resolution, and they are significant. R11 and R12 are high-density districts (expect them to be mapped in Manhattan and central business districts in the outer boroughs) that allow residential FARs of up to 15.0 and 18.0, respectively, provided affordable housing is included.

For now, these districts are established and they will require separate rezonings to be mapped. However, we already know about the first planned rezoning: the Midtown South Mixed-Use Plan, which proposes to map both R11 and R12 districts.

Midtown South Rezoning will turn the Garment Center into one of the hottest residential neighborhoods in the city! Yes, you heard it here first.
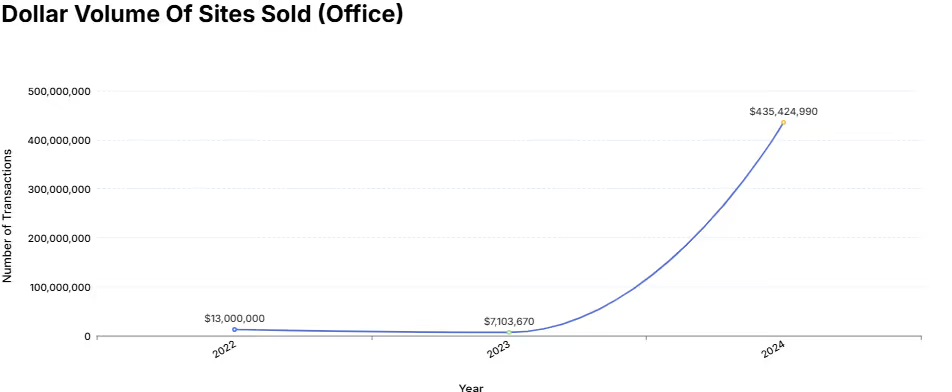
Expanded Residential Conversion Eligibility
Here’s one we’ve been discussing a lot this year: COYHO significantly expands the eligibility criteria for converting non-residential buildings into housing. Previously, the rule was limited to buildings constructed before 1961 (or 1977 in Lower Manhattan). The new rule extends the cutoff to 1991 and broadens the geography to include almost the entire city.

This change makes an entire generation of non-residential buildings (constructed between 1961 and 1991) eligible under the zoning’s conversion rules. And let’s face it—many of these buildings could use a lifeline right about now. With almost 90 million square feet of vacant office space (particularly in Class B & C assets), and a desperate need for housing, this new legislation should produce a ton of activity.
Sliver Law Reforms
The “sliver law,” which has restricted building heights on narrow lots for decades, has been eliminated for projects utilizing Quality Housing regulations (those with defined height and setback requirements). This change significantly enhances the development potential of certain small sites (“infill” sites) in high-density neighborhoods.

There have been some districts in Midtown that did not have Sliver Law prohibitions, but virtually every other neighborhood in Manhattan did. This will change the nature of the boutique development business.
Increased Height for Large Sites
Here’s one more accretive aspect that didn’t get much attention during the public review process. Take a look at the new ZR Section 23-434 (it’s in here, which is all we have for now), which allows for taller buildings on “eligible” sites. This addresses a longstanding issue with the city’s contextual zoning rules: their lack of nuance, particularly for larger sites. Finally, there’s some relief.

I’ll leave it to our zoning and architecture professionals to fully unpack the ramifications, but my take is that this change is very consequential for larger sites in contextual districts. One example: in R8 districts, under the Quality Housing rules, the maximum height has been 135 feet. Per the new Section 23-434, on eligible larger sites, that height increases to 215 feet—or up to 255 feet if UAP is included. That’s no small difference!

BKREA's Manhattan Development Pipeline

How to Interpret the Development Pipeline
During the pandemic, Bob drove and walked every block of Manhattan south of 96th Street on the eastside and south of 110th Street on the westside. The intent was to look at every building that was under construction. While in the field, we did a lot more than just that as we also logged projected development sites and potential assemblages. After determining what was under construction, the research began. We then disaggregated the data into five buckets: residential rental, residential condo, office, hotel and miscellaneous (to hold everything that didn’t fit into one of the first four buckets). Since the field inspection was done, we have tracked every demolition permit, every foundation permit and every building permit and our development pipeline is now down to the square inch.

Further, BKREA’s development pipeline is broken down into “Pending” and “Active” categories. The Pending category consists of sites purchased by developers, sites where plans have been filed, they have been demolished or in some way are preparing for development. As soon as the developer get a construction loan, the site flips into the Active bucket.Here is a summary of the Pending and Active categories as of the end of 2024:
Pending
These are sites that have been purchased by a developer, where existing buildings have been demolished or are planned for demolition. A green plywood fence has been erected around the site, but there does not appear to be any activity. No heavy machinery is present.
- A demolition application or a new building application has been filed.
- The asset types are subject to change until they actively start construction.
Active
These are sites where the developer has obtained a construction loan and/or there is activity on the site. Excavation and foundation work typically take place below grade, and construction begins to rise above street level. The status of the construction loan is usually determined retrospectively. In general, activity on the site starts within days of securing the construction loan.
Pending Development Pipeline
Asset ClassBuildable Square Footage# of Projects
Rental6,650,51239
Condo9,671,727127
Office21,113,55233
Hotel5,536,19338
Misc7,803,63614
Active Development Pipeline
Asset ClassBuildable Square Footage# of ProjectsUnits
Rental2,181,098192,547
Condo7,517,296764,743
Office3,200,5047-
Hotel1,076,51482,632
Misc.1,159,23612-
For a visual representation, please scroll down to our interactive map below
2024 Demolition Applications
“Filings” are the number of individual buildings to be demolished and “Projects” are the development sites that all of the filings create. For example, if five adjacent buildings are demolished to make way for a single new building, that would be five filings and one project.
2024 Demolition Applications
Activity TypeDemolition Applications
Filings88
Projects43

Data Spotlight: Land Trends

Land Market Overview: 2024 vs. 2023 & 2022:
A Detailed Comparison In this section, we provide an in-depth analysis of recent land market trends in Manhattan, breaking down key data points by asset bucket to offer a comprehensive view of the market’s dynamics. The land market is nuanced, with pricing varying significantly depending on a range of factors such as location, zoning regulations, and development expansion/assemblage potential. These variables play a critical role in determining land value.

For a more granular understanding, our insights are drawn from The Knakal Land Index, which will be published shortly and has tracked land transaction data going back to 1984. This robust dataset allows us to offer a clear, data-driven overview of the land market’s activity, highlighting shifts in pricing, demand, and development trends. Here we offer just a short-term snippet of the broader data:
Number of Sales: The Knakal Land Index
Asset Class202220232024*
Residential Condo212124
Residential Rental713
Office111
Hotel110
Misc310
Totals332528
* Please note the 2024 land sales statistics are still being verified. We expect to have final numbers by the next issue.
Development Bulk (in buildable square footage): The Knakal Land Index
Asset Class202220232024
Residential Condo$2,776,594$1,610,803$1,864,980
Residential Rental$1,289,366$90,439$574,271
Office$29,230$15,800$749,076
Hotel$14,814$241,287$0
Misc$161,576$41,331$0
Totals$4,271,580$1,999,659$3,188,327
Dollar Volume: The Knakal Land Index
Asset Class202220232024
Residential Condo$1,793,262,123$1,423,558,039$1,032,324,795
Residential Rental$359,075,910$26,790,250$105,185,880
Office$13,000,000$7,103,670$435,424,990
Hotel$7,075,000$174,625,250$0
Misc$58,370,401$16,247,865$0
Totals$2,230,783,434$1,648,325,074$1,572,935,665
Price Per Buildable Square Foot: The Knakal Land Index
Asset Class202220232024
Residential Condo$483$528$559
Residential Rental$302$296$203
Office$445$450$581
Hotel$478$724N/A
Misc$372$393N/A
In the sections below, we will take a deep dive on each of the five major buckets of property types for our development deals. BKREA has all of the granular data to support the findings and would be happy to discuss that data with you if you like. Feel free to call your BKREA agent to discuss that data.

Residential Condominiums

Pipeline Metrics
Residential CondosPendingActive
Number of Projects12776
Buildable Square Feet9,671,7277,517,296
Historical Sales Metrics: Based on The Knakal Land Index
Condos202220232024
Number of Transactions212124
Total Dollar Volume$1,793,262,123$1,423,558,039$1,032,324,795
Total Buildable Square Footage2,776,5941,610,8031,864,980
Price Per Buildable Square Foot$483$528$559

Residential Rentals

Pipeline Metrics
Residential RentalsPendingActive
Number of Projects3919
Buildable Square Feet6,650,5122,181,098
Historical Sales Metrics: Based on The Knakal Land Index
Rentals202220232024
Number of Transactions713
Total Dollar Volume$359,075,910$26,790,250$105,185,880
Total Buildable Square Footage1,289,36690,439574,271
Price Per Buildable Square Foot$302$296$203

Office

Pipeline Metrics
OfficePendingActive
Number of Projects337
Buildable Square Feet21,113,5523,200,504
Historical Sales Metrics: Based on The Knakal Land Index
Office202220232024
Number of Transactions111
Total Dollar Volume$13,000,000$7,103,670$435,424,990
Total Buildable Square Footage29,23015,800749,076
Price Per Buildable Square Foot$445$450$581

Hotels

Pipeline Metrics
HotelsPendingActive
Number of Projects388
Buildable Square Feet5,536,1931,076,514
Historical Sales Metrics: Based on The Knakal Land Index
Hotels202220232024
Number of Transactions110
Total Dollar Volume$7,075,000$174,625,250$0
Total Buildable Square Footage14,814241,2870
Price Per Buildable Square Foot$478$7240

Miscellaneous

Pipeline Metrics
MiscellaneousPendingActive
Number of Projects1412
Buildable Square Feet7,803,6361,159,236
Historical Sales Metrics: Based on The Knakal Land Index
Miscellaneous202220232024
Number of Transactions310
Total Dollar Volume$58,370,401$16,247,865$0
Total Buildable Square Footage161,57641,3310
Price Per Buildable Square Foot$372$3930

Active Sites in
Manhattan: An Interactive Map

How to Interpret the Map
Active
These are sites where the developer has obtained a construction loan and/or there is activity on the site. Excavation and foundation work typically take place below grade, and construction begins to rise above street level. The status of the construction loan is usually determined retrospectively. In general, activity on the site starts within days of securing the construction loan.
How to Navigate the Interactive Map
This is a map highlighting every site that is actively under construction (“Active”). Here's how it works:
1
Step 1
Click on "Active"
2
Step 2
Click Development Type
3
Step 3
Select green circles for more information on the site
4
Step 4
Enjoy!
Development Status
Development Type

Exclusive Insights

This section contains exclusive insights gathered directly by the BKREA team from market participants. Each month, we compile information based on conversations with owners, developers, users, lenders, attorneys, zoning experts, and many others in the industry. These insights reflect the pulse of the market as we hear it from the professionals we work with, offering an unfiltered look at current trends and expectations. Please note, this data should be viewed as a reflection of ongoing market discussions with active market participants.
City of Yes: Opportunities for Landmark Air Rights
Under the City of Yes initiative, landmark air rights transfers have been significantly expanded. Air rights can now be transferred to a broader range of lots, including:- Any lot on the southern portion of the block north of the subject site’s block.- The northern blockfront of the block south of the subject site’s block.- Blockfronts directly east and west of the subject site’s block.- The four corner lots on the diagonally adjacent blocks.
- Any lot on the southern portion of the block north of the subject site’s block.
- The northern blockfront of the block south of the subject site’s block.
- Blockfronts directly east and west of the subject site’s block.
- The four corner lots on the diagonally adjacent blocks.
Bring Back 421a — Why Developers Consider 485x Useless (except for developments 99 units or less)- Stricter affordability requirements: 485x incentives focus on deeply affordable units set at 60%-80% AMI, unlike 421a, which allowed affordability at 130% AMI.
- Permanent affordability: Affordable units under 485x must remain affordable permanently.
- Increased wage requirements: Construction workers' wages are set on a sliding scale, starting at $40/hour for projects with over 100 units, increasing 2.5% annually.Location-based wage variations: Higher compensation rates apply to developments in Lower Manhattan and waterfront areas of Brooklyn and Queens.
485-X Wage Requirements
City Wide (6-99 Units)Zone A & B (100-149 Units) or 100+ Units Outside of Zone A or B)Zone B (150+ Units)Zone A (150+ Units)
None$40 per hour (increasing by 2.5% every year starting on July 1, 2025))$63 per hour (increasing by 2.5% every year starting on July 1, 2025) or 60% of prevailing wage, whichever is less.$72.45 per hour (increasing by 2.5% every year starting on July 1, 2025) or 65% of prevailling wage, whichever is less.)

Development Site Listings

80 South Street

Frontage: 97' on South Street, 144' on Fletcher Street, 25' on Front Street (irregular)

ZFA: 817,784 SF

Zoning: C5-3, LM

339-345 East 33rd Street

Frontage: 90' on the NS of East 33rd Street

ZFA: 122,846 SF

Zoning: C1-9A (R10A), MIH

Note: This site is vested in the 421-A program

1800 Park Avenue

Frontage: 142.5' on E 124th, 201.85' on Park Ave, 215' on E 125th St

ZFA:
488,759 SF

Potential ZFA:
682,317 SF

Zoning:
C4-7, 125 Street Special District

539 West 54th Street

Frontage: 125' of frontage on NS of 54th Street

ZFA:
81,571 SF

ZFA With UAP:
90,355 SF

Zoning:
R8, CL (Special Clinton District)

139-141 East 45th Street

Frontage: 42' on NS of East 45th St

ZFA:
50,604 SF

Zoning:
C5-2.5, MiD

2 Thomas Street

Frontage: 65' on Broadway & 105' on Thomas

ZFA:
81,348 SF

Zoning:
C6-4A (R10A)

10 West 17th Street

Frontage: 45' Feet on SS of West 17th Street

ZFA:
41,400 SF

Zoning:
C6-4A (R-10A), Ladies Mile Historic District

118-120 East 59th Street

Frontage: 50' on SS of East 59th Street

ZFA:
76,739 SF

Zoning:
C5-2.5, MiD

West 37th Street

Frontage: 100' on NS of West 37th Street

ZFA:
98,830 SF

With Off-Site IH Certificates and/or DIB:
118,596 SF

Zoning:
C6-4M, GC* (A-2 subdistrict)

28-30 West 37th Street

Frontage: 48.92' on SS of West 37th Street

ZFA:
48,310 SF

ZFA Under MSMX:
86,958 SF

Zoning:
M1-6

462-470 Eleventh Avenue

Frontage: 123.42' on 11th Avenue, 125' on West 38th Street

ZFA:
148,100 SF

ZFA With DIB & ERY:
319,896 SF

Zoning:
C6-4, HY

1299 First Avenue

Frontage: 25.5' on First Avenue & 77’ on East 70th Street

ZFA:
19,635 SF

Zoning:
C2-8A

Corner of Dekalb and Ashlyn

Frontage: 351' Feet

ZFA:
4,000,000 SF

Zoning:
R6

Highlights:
Five Development Pads

500-516 8th Avenue

Frontage: 197 Feet

Total Lot Size:
22,348 SF

ZFA:
223,480 SF

ZFA (MSMX Passes):
402,264 SF

Zoning:
M1-6 / GC

1880 East Tremont Avenue, Parkchester

Frontage: 176' on East Tremont Avenue, 317' on Unionport Road, 323' White Plains Road & 261' on Guerlains Street

ZFA:
489,218 SF

Potential GSF:
606,232 SF

Zoning:
R8 (MIH)

1341-1347 Second Avenue

Frontage: 100.42' on 2nd Avenue & 100' on East 71st Street

ZFA:
100,417 SF

ZFA (With IH Bonuses):
120,500 SF

Zoning:
C1-9 (R10 Equivalent)

136-140 West 44th Street

Frontage: 50' of frontage along West 44th Street

ZFA:
74,270 SF

Potential ZFA:
143,377 SF

Zoning:
C6-5.5, MID

45 Beach Street & 560 Bay Street

Frontage: Approximately 575 feet of frontage along three sides

ZFA:
119,664 SF

Zoning:
C4-2 (R6 Equivalent)C6-4X / M1-6 (Air Rights Lot)

CB-5 Air Rights

BKREA is under contract with off-site inclusionary housing air rights. Eligible receiver sites are 0.5 miles from 36-48 West 33rd Street and/or in Community Board 5.

ZFA:
15,000 SF

CB-5 Air Rights

BKREA has been retained to sell off-site inclusionary housing air rights. Eligible receiver sites are 0.5 miles from 36-48 West 33rd Street and/or in Community Board 5.


ZFA: 75,000 SF

Southside of Oak Street along the East River

Frontage: 324.5' along Oak Street, 104.8' along East River, 100' along Wharf Drive

ZFA:
110,773 SF

Zoning:
R6

NoMad Corner

Frontage: 63.44' on 6th Ave91.67' on West 29th Street

ZFA:
148,896 SF

With Offsite IH Certificates:
176,858 SF

Zoning:
C6-4X (Dev Lot)C6-4X / M1-6 (Air Rights Lot)

Note:
Prior to MSMX Passing

Midtown Blockthrough Blockbuster

Lot Size: Almost 1 Acre

ZFA:
533,199 SF

Potential ZFA Under MSMX:
697,619 SF

Current Zoning:
M1-6

Zoning Under MSMX:
M1-8A / R12

Sign Up Now!

If you would like to receive our new listings, market updates & research, company announcements, and thought leadership, please sign up below.

A Bob Knakal Company

Our dedication has been, and will always be, to put the client’s best interests first! If you would like to take advantage of the unparalleled experience we offer, please call, text or email us as we would love to work with you.We are a new venture that provides capital markets transaction and consulting services to property owners. It is a company founded by Bob Knakal, one of the most recognized and accomplished investment sales brokers in the United States. As has been Bob's operating practice since 1984, in the investment sales arena, the company will only represent sellers, will only work exclusively, and will only sell properties in New York City. Consulting services will be provided to all market participants.

Contact BKREA

For all inquiries, reach out to your BKREA team member:

Bob Knakal
Chairman & CEO
Ryan Candel
Senior Vice President, Transactions
Genessy Jaramillo
Managing Director
Jas Saini
Senior Associate
Justin Rice-Moore
Senior Associate
Jake Hulsh
Associate